Gilles Crofils

Gilles Crofils

Hands-On Chief Technology Officer

Based in Western Europe, I'm a tech enthusiast with a track record of successfully leading digital projects for both local and global companies.1974 Birth.
1984 Delved into coding.
1999 Failed my First Startup in Science Popularization.
2010 Co-founded an IT Services Company in Paris/Beijing.
2017 Led a Transformation Plan for SwitchUp in Berlin.
May 2025 Eager to Build the Next Milestone Together with You.

Interactive Data Visualization Tools

Abstract:

Data visualization is crucial for informed decision-making, offering graphical representations of complex data. Various tools enable the conversion of raw data into visual formats like charts and graphs, improving operational efficiency and customer experiences. Interactive data tools, such as dashboards, empower real-time data analysis and drive innovation. Collaboration among technology and engineering leaders is essential for successful integration of these tools, requiring a balance between fostering innovation and managing risk through strategies like data governance and employee training. This approach can unlock opportunities, drive growth, and establish market leadership.

An abstract, blue-toned illustration showing the transformation of raw data into intricate formats such as charts and graphs, with various elements included to represent the tools and mechanisms of the process, such as digital dashboards. The image should incorporate anonymized human figures, representing a diverse set of leaders in technology and engineering fields, gathered in collaboration around a central innovative structure. This central structure, while abstract, should hint at data governance, risk management, and innovation. The composition should emphasize the themes of unlocking potential, driving growth, and achieving market leadership through strategic utilization of data visualization, presenting a complex but inviting representation of informed decision-making.
Elevating Decision-Making with Data Visualization and Interactive Tools: A Chief Technology Officer's Perspective

Data Visualization: A Powerful Catalyst for Informed Decision-Making

As a Chief Technology Officer (CTO), I've experienced the transformative impact of data visualization firsthand. Data visualization refers to the art of interpreting and presenting data in a graphical format, enabling stakeholders to grasp complex concepts with ease. This powerful tool has revolutionized our approach to data analytics, fostering a data-driven culture that empowers us to make informed decisions backed by actionable insights.

Demystifying Data Visualization Solutions

A plethora of data visualization solutions exists, each catering to unique organizational needs and data complexities. These tools convert raw data into charts, graphs, and other visual representations, effectively conveying trends, patterns, and outliers. By incorporating these solutions, my organization has improved its operational efficiency, enhanced customer experiences, and bolstered its competitive advantage.

Interactive Data Tools: Bridging the Gap Between Data and Actionable Insights

Interactive data tools have played a pivotal role in empowering my engineering and technology teams to analyze, explore, and manipulate data in real-time. These tools include interactive dashboards, which have streamlined our decision-making processes and revealed critical insights. By investing in these cutting-edge solutions, we've fostered a culture of curiosity and engagement among our workforce, ultimately driving innovation and growth.

The Power of Interactive Dashboards

Interactive dashboards serve as a centralized hub for accessing, interpreting, and engaging with data. In my role as a CTO, I've witnessed the profound impact these tools have on fostering data literacy and democratizing access to critical insights. Interactive dashboards have allowed our teams to drill down into granular data, identify patterns, and uncover correlations, ultimately guiding strategic planning, resource allocation, and performance optimization efforts.

Collaboration and Alignment Across Technology and Engineering Leadership

Collaboration between Directors of Technologies, Directors of Engineering, and Chief Technology Officers is paramount to the successful adoption and integration of data visualization and interactive tools. By fostering a cohesive and aligned leadership team, we've been able to lay a solid foundation for data-driven decision-making and drive innovation across our organization. As technology and engineering leaders, we must continuously explore emerging trends, evaluate new tools, and champion a data-driven culture that permeates every level of our organization.

Striking a Balance: Fostering Innovation and Managing Risk

While data visualization and interactive tools offer immense potential, it's crucial for technology and engineering leaders to strike a balance between fostering innovation and managing risk. Implementing robust data governance strategies, investing in employee training, and promoting cross-functional collaboration are essential to ensuring the successful deployment and utilization of these solutions. By focusing our efforts on realizing the full potential of data visualization and interactive tools, we can unlock new opportunities, drive growth, and solidify our organization's position as a market leader.

You might be interested by these articles:

See also:


25 Years in IT: A Journey of Expertise

2024-

My Own Adventures
(Lisbon/Remote)

AI Enthusiast & Explorer
As Head of My Own Adventures, I’ve delved into AI, not just as a hobby but as a full-blown quest. I’ve led ambitious personal projects, challenged the frontiers of my own curiosity, and explored the vast realms of machine learning. No deadlines or stress—just the occasional existential crisis about AI taking over the world.

2017 - 2023

SwitchUp
(Berlin/Remote)

Hands-On Chief Technology Officer
For this rapidly growing startup, established in 2014 and focused on developing a smart assistant for managing energy subscription plans, I led a transformative initiative to shift from a monolithic Rails application to a scalable, high-load architecture based on microservices.
More...

2010 - 2017

Second Bureau
(Beijing/Paris)

CTO / Managing Director Asia
I played a pivotal role as a CTO and Managing director of this IT Services company, where we specialized in assisting local, state-owned, and international companies in crafting and implementing their digital marketing strategies. I hired and managed a team of 17 engineers.
More...

SwitchUp Logo

SwitchUp
SwitchUp is dedicated to creating a smart assistant designed to oversee customer energy contracts, consistently searching the market for better offers.

In 2017, I joined the company to lead a transformation plan towards a scalable solution. Since then, the company has grown to manage 200,000 regular customers, with the capacity to optimize up to 30,000 plans each month.Role:
In my role as Hands-On CTO, I:
- Architected a future-proof microservices-based solution.
- Developed and championed a multi-year roadmap for tech development.
- Built and managed a high-performing engineering team.
- Contributed directly to maintaining and evolving the legacy system for optimal performance.
Challenges:
Balancing short-term needs with long-term vision was crucial for this rapidly scaling business. Resource constraints demanded strategic prioritization. Addressing urgent requirements like launching new collaborations quickly could compromise long-term architectural stability and scalability, potentially hindering future integration and codebase sustainability.
Technologies:
Proficient in Ruby (versions 2 and 3), Ruby on Rails (versions 4 to 7), AWS, Heroku, Redis, Tailwind CSS, JWT, and implementing microservices architectures.

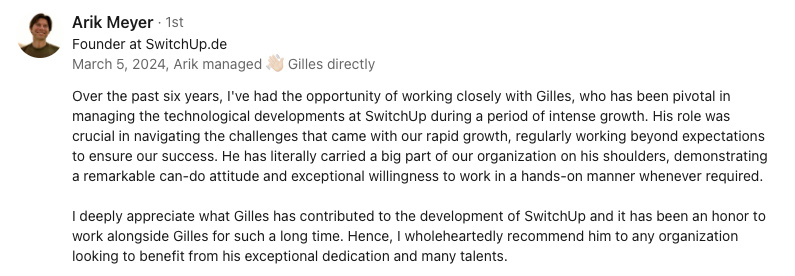
Arik Meyer's Endorsement of Gilles Crofils
Second Bureau Logo

Second Bureau
Second Bureau was a French company that I founded with a partner experienced in the e-retail.
Rooted in agile methods, we assisted our clients in making or optimizing their internet presence - e-commerce, m-commerce and social marketing. Our multicultural teams located in Beijing and Paris supported French companies in their ventures into the Chinese market

Cancel

Thank you !

Disclaimer: AI-Generated Content for Experimental Purposes Only

Please be aware that the articles published on this blog are created using artificial intelligence technologies, specifically OpenAI, Gemini and MistralAI, and are meant purely for experimental purposes.These articles do not represent my personal opinions, beliefs, or viewpoints, nor do they reflect the perspectives of any individuals involved in the creation or management of this blog.

The content produced by the AI is a result of machine learning algorithms and is not based on personal experiences, human insights, or the latest real-world information. It is important for readers to understand that the AI-generated content may not accurately represent facts, current events, or realistic scenarios.The purpose of this AI-generated content is to explore the capabilities and limitations of machine learning in content creation. It should not be used as a source for factual information or as a basis for forming opinions on any subject matter. We encourage readers to seek information from reliable, human-authored sources for any important or decision-influencing purposes.Use of this AI-generated content is at your own risk, and the platform assumes no responsibility for any misconceptions, errors, or reliance on the information provided herein.

Alt Text

Body